EPA radon zones explained: Zone 1, 2 and 3 by county
EPA maps counties into three radon zones by predicted indoor average. What Zone 1, 2 and 3 mean, how the map is built, and why it cannot replace a test.
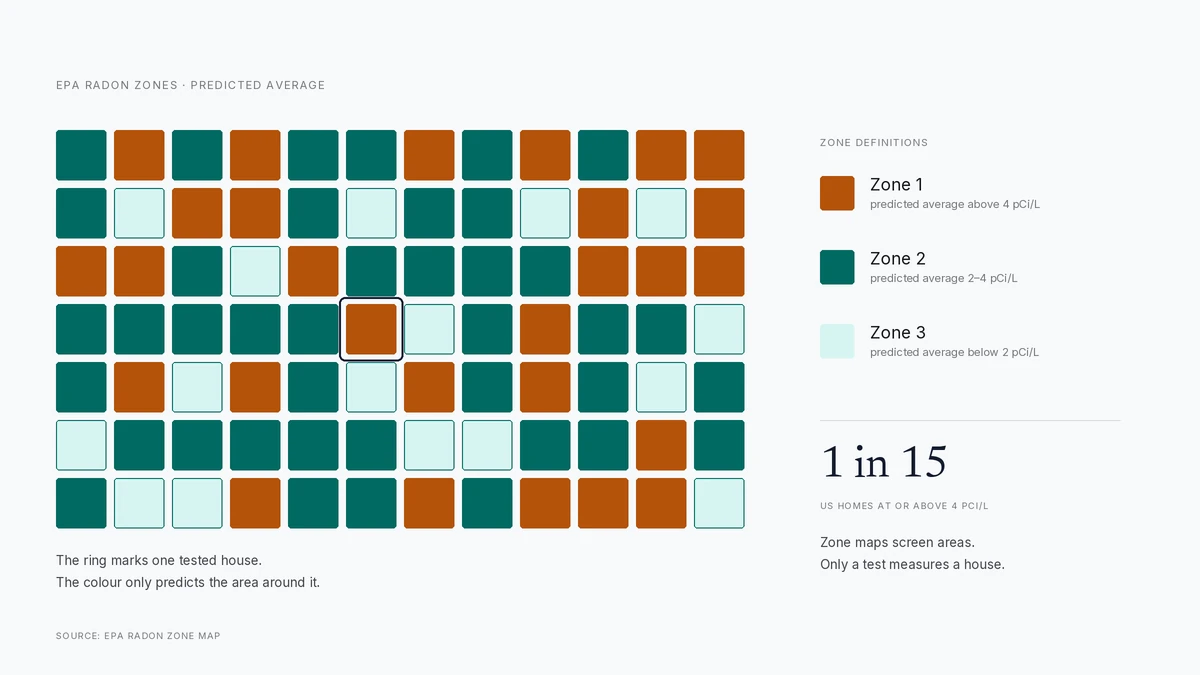
EPA assigns every county to one of three radon zones by predicted average indoor level: Zone 1 above 4 pCi/L, Zone 2 between 2 and 4, Zone 3 below 2. The map screens areas, not houses, and homes in every zone have tested high.
- Zone 1
- predicted average above 4 pCi/L
- Zone 2
- predicted average 2–4 pCi/L
- Zone 3
- predicted average below 2 pCi/L
- US homes above 4 pCi/L
- about 1 in 15
Some links on this page are affiliate links.If you buy through them we may earn a commission at no extra cost to you. We do not accept payment for rankings. Read the full disclosure.
| Zone 1 (above 4 pCi/L predicted) | Zone 3 (below 2 pCi/L predicted) | |
|---|---|---|
| What the label means | The county average is predicted above the action level | The county average is predicted below 2 pCi/L |
| Testing priority | Test every home, and test before buying | Test anyway; local sources can override the county pattern |
| Mitigation likelihood | Higher share of homes above 4 pCi/L | Lower share, but not zero |
| Cost of a system | Same bands: $800–$2,500 sub-slab | Same bands; the zone does not set the price |
An EPA radon zone is a county-level prediction of the average indoor radon level a house in that county is likely to see. It exists so that public health departments, builders and homeowners can prioritise testing and prevention before anyone has measured a specific basement. It is a screening tool, and reading it as a diagnosis is the most common mistake made with it.
What an EPA radon zone is
EPA divides the country’s counties into three zones based on a predicted average indoor radon concentration. The prediction comes from a combination of indoor measurements, geology, and aerial radioactivity surveys. Each county gets one label. The label describes the county, not the house, the street or the slab.
That distinction is the whole article. A county is a large area with different soils, different construction styles and different foundation depths. A zone map summarises all of that into one letter. A test measures one room in one building.
The three zone definitions
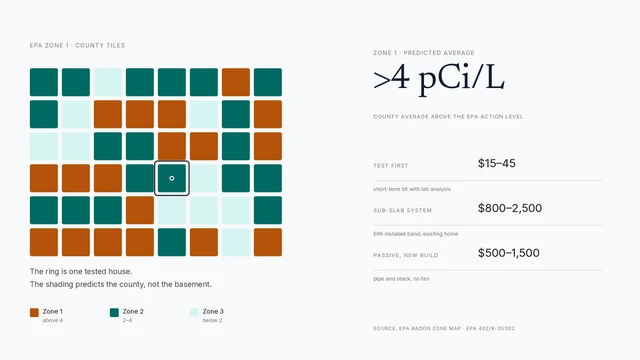
Zone 1 counties have a predicted average above 4 pCi/L, the highest risk category. These are the counties where testing is most likely to find a home above the action level.
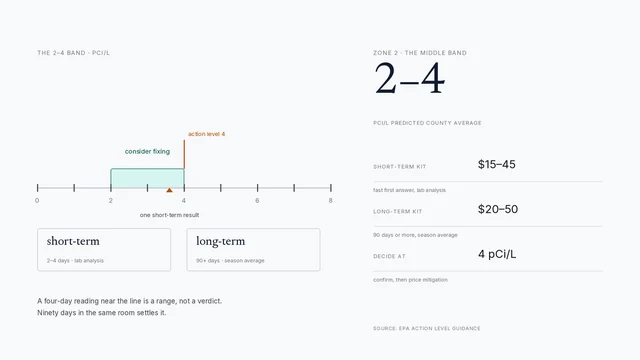
Zone 2 counties have a predicted average between 2 and 4 pCi/L — the middle band, and the one that produces the most ambiguous advice, because a house there can land on either side of the action level.
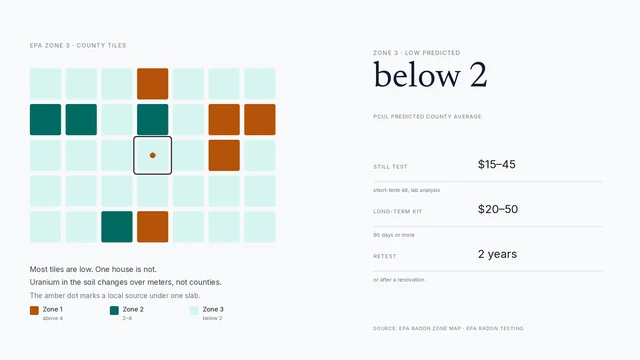
Zone 3 counties have a predicted average below 2 pCi/L. Low risk is not no risk, and EPA’s guidance is still to test.
EPA’s action level is 4 pCi/L. The zone thresholds are built around it: Zone 1 starts where the predicted average crosses the level at which EPA says to fix the house.
How the map is built
EPA’s zone map is not a survey of every basement. It is a model. The agency combined three inputs: indoor radon measurements where they existed, geological information about radon-producing rock and soil, and aerial radioactivity data that detects uranium-series material at the surface.
The current county map was updated in 2024 and is published as a national map, a set of state maps and a downloadable file. The underlying data is old enough that some local patterns have been refined by state programs, which is why a state map is often more useful than the national one for a single house.
What Zone 1 does and does not mean
Zone 1 means the county’s predicted average is above 4 pCi/L. It does not mean your house reads above 4. It does not mean your neighbour’s house does either. Two houses on the same street can differ by a factor of five because one sits on a slab and the other has a basement with a sump.
What Zone 1 does mean is that the prior probability is higher. If you are buying in a Zone 1 county, testing is not optional in any practical sense. If you are building, it is the strongest argument for a passive system. If you already live there and have never tested, the zone is a reason to spend $30 this month.
Zone 2: the ambiguous middle
Zone 2 is where the advice gets soft. The county average is between 2 and 4 pCi/L, which means some houses are below the action level and some are above it. A single short-term test can land on either side of the line, and a second test in a different season can disagree with the first.
The practical answer is to test, and if the result is between 2 and 4 pCi/L, to test again with a long-term kit rather than rushing to a mitigation quote. EPA says consider fixing in that band. “Consider” is doing real work in that sentence: it is a risk decision, not a code violation.
Zone 3: low predicted, not zero
Zone 3 counties are predicted below 2 pCi/L. The houses there are less likely to have a problem, and the testing rate is usually lower, which is exactly why local surprises persist. A Zone 3 house on a radon-bearing soil or with a deep basement can read above 4 pCi/L.
EPA’s position is unchanged across all three zones: test every home. The zone changes how urgently you test and how much weight to put on a borderline result, not whether testing is worth doing.
Why the map is still useful
Three reasons. It targets public testing programs at the counties where they will find the most problems. It informs building codes: several states and local jurisdictions require radon-resistant new construction in designated counties, and those designations usually trace back to the zone map. And it gives a homeowner a prior, which is useful when a first test comes back at 3.8 pCi/L and you need to decide whether to retest or move.
The map is also a budget tool, indirectly — the calculator turns a foundation type into a planning number. If you live in a Zone 1 county and have never tested, the expected value of a $30 kit is high. If you live in a Zone 3 county and test low, the expected value of a $1,200 system is low. The zone helps you decide where to spend the next dollar, not what the dollar will buy.
How to use your zone number
Look up the county. Test the lowest lived-in level. If the result is at or above 4 pCi/L, get a certified measurement or move to mitigation, then price the work with the cost guide. If it is between 2 and 4 pCi/L, run a long-term test. If it is below 2 pCi/L, keep the report and retest every two years or after a major renovation.
Then use the zone for what it is good for: context. A Zone 1 county with a low house reading is good news and a reason to retest in a few years. A Zone 3 county with a high reading is a reminder that the map was never about your house.
Where to look up your county
EPA publishes the national map and state-level versions on its radon zone page. State radon programs usually publish a cleaner state map with county names, and some offer a search by address. Several also sell subsidised test kits; the state cost guide covers that. The county name is the key: ZIP codes cross county lines, and townships are not the unit of assignment.
If the map and a state program disagree, trust the state program for local detail and the EPA map for the national picture. Neither one replaces a test.
The bottom line
A radon zone is a county-level prediction, not a measurement. Zone 1 raises the odds and should raise your urgency. Zone 3 lowers the odds and should not lower your guard. The only number that describes your house is the one that comes back from a test — and the only number that describes your system is the one that comes back after it runs.
How to do it
- Look up the county, not the townEPA zones are assigned at county level. Use the county name, and check the state radon program map if the EPA PDF is hard to read.
- Treat the zone as a prior, not a resultA Zone 1 label raises the odds that testing finds a problem. It does not measure your house, your slab or your soil.
- Test the lowest lived-in levelA short-term kit ($15–$45) or a certified measurement ($150–$250) in the basement or first floor gives the number the zone cannot.
- Retest across seasons if the result is closeA reading between 2 and 4 pCi/L is the ambiguous range. A long-term kit or a winter retest resolves it better than a second four-day snapshot.
- Budget from the reading, not the zoneAt or above 4 pCi/L, price a system using the foundation bands. Below 2 pCi/L, keep the report and retest every couple of years.
Frequently asked questions
What are the three EPA radon zones?
Zone 1 counties have a predicted average indoor radon above 4 pCi/L, the highest risk category. Zone 2 counties sit between 2 and 4 pCi/L. Zone 3 counties are predicted below 2 pCi/L. The prediction is for the county as a whole, not for any individual house.
Does living in Zone 1 mean my house has high radon?
No. Zone 1 means the county's predicted average is above the action level, so the odds of a high reading are greater. Plenty of Zone 1 houses test below 2 pCi/L, and Zone 3 houses test above 4. The only way to know your house is to test it.
Can I skip testing if I live in Zone 3?
No. EPA says every home should be tested regardless of zone. Zone 3 is a prediction about an area, and geology changes over short distances. A house on a local radon source can read high in a county that is mostly low.
How did EPA build the county zone map?
EPA combined indoor radon measurements, geological information and aerial radioactivity survey data, then assigned each county a predicted average. The current map is a screening tool intended to target testing and construction policy, not to substitute for measurement.
Does the zone affect mitigation cost?
Only indirectly. The system price depends on the foundation and the number of suction points, not the zone. What the zone changes is the likelihood that you will need a system at all, and how common certified contractors and testing programs are in your area.
Where do I find my county's zone?
EPA publishes the county map and a downloadable version on its radon zone page. Many state radon programs also publish a state-level map with county names, which is easier to read for a single state.
Sources
Some links are affiliate links.If you buy through them we may earn a commission at no extra cost to you. We do not accept payment for rankings. Read the full disclosure.