State radon maps vs the EPA county map
State programs refine the EPA county map with local data and often show towns. Neither is a house test. How to use both without overreading either.
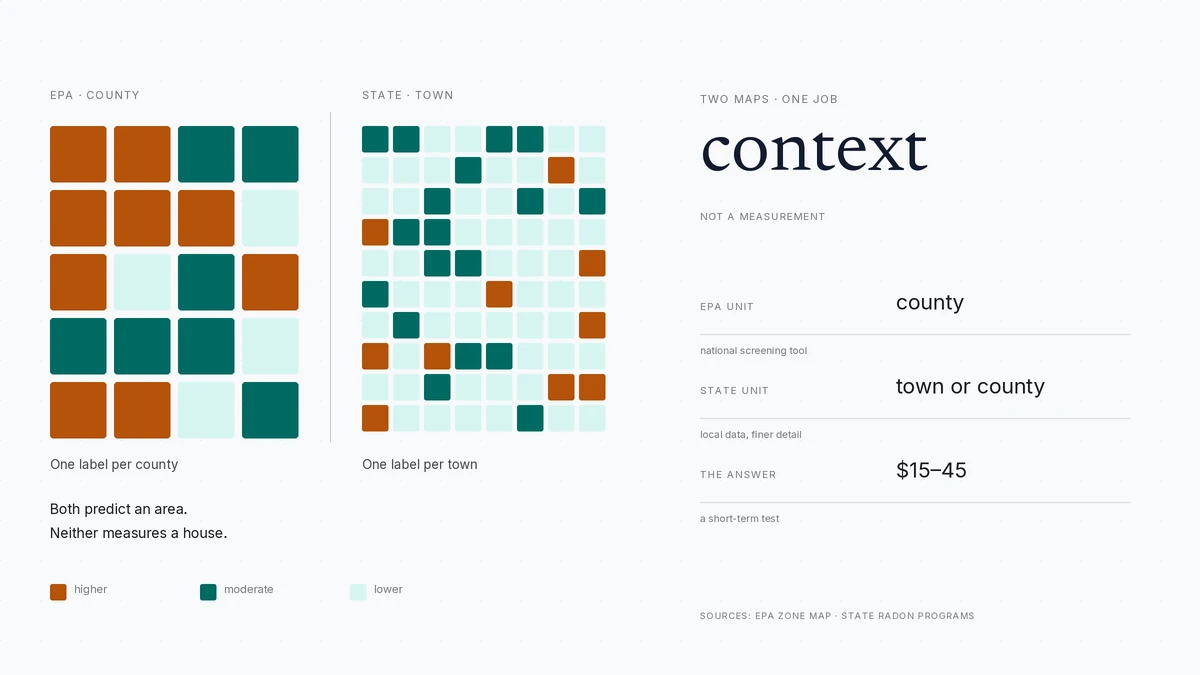
The EPA map assigns every county a predicted radon average in one of three zones. State programs refine it with their own data and often show towns. Neither tests a house: use the state map for local context and a $15–$45 test for the building.
- EPA map unit
- county
- State map unit
- often county or town
- What both predict
- an area average, not a house
- What settles it
- a $15–$45 test
Some links on this page are affiliate links.If you buy through them we may earn a commission at no extra cost to you. We do not accept payment for rankings. Read the full disclosure.
| EPA county map | State radon map | |
|---|---|---|
| Who publishes it | US EPA, nationally | The state health or environmental agency |
| Unit of assignment | County | Often county, town or township |
| Inputs | Indoor data, geology, aerial radioactivity surveys | State measurements, local geology, sometimes both plus the EPA framework |
| Best use | National comparison and building policy | Local context for one address |
| Main limitation | Too coarse for a single house | Still an area prediction, and quality varies by state |
| What it cannot do | Measure a building | Measure a building |
A state radon map is a map published by a state health or environmental agency that predicts radon risk for areas inside that state, usually at county or town level. It sits on top of the national EPA map, which assigns every US county to one of three zones by predicted average indoor radon. The two are related and often look alike, but they answer different questions at different scales — and neither one measures a house.
Two maps, two jobs
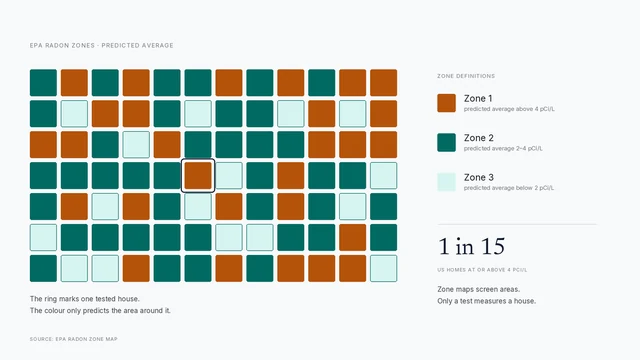
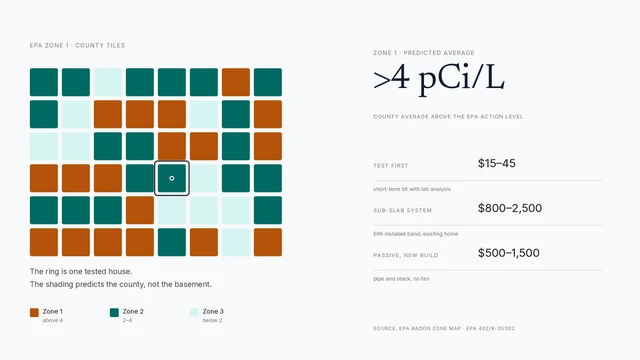
The EPA map is a national screening tool. It exists so that public health agencies, builders and code officials can compare counties and target testing programs and construction rules. Its unit is the county, and its output is one of three zones: Zone 1 predicted above 4 pCi/L, Zone 2 between 2 and 4, Zone 3 below 2. The zones section collects the definitions in one place.
A state map is a local refinement. State radon programs collect their own measurements, sometimes over decades, and many publish a map that resolves to town, township or minor civil division level. The state map usually keeps the same three-zone logic but replaces or supplements the national model with data the state trusts more for its own territory.
The EPA zone overview explains the national model in detail. This page is about what happens when a state program puts its own data on top of it.
How state programs refine the EPA data
Three kinds of refinement show up repeatedly.
The first is more measurements. A state that has run a subsidised test-kit program for years accumulates thousands of results the national model never saw. Those results can move a county or a town up or down, and they can reveal a local pattern the county average hides.
The second is geology. Some states overlay bedrock or surficial geology maps — granite, shale, limestone karst, glacial deposits — and adjust the prediction where the underlying material is a known radon source. That produces boundaries that follow rock rather than county lines.
The third is scale. Where the measurement density supports it, a state publishes at town level. A town of 12,000 people is a much better unit than a county of 400,000, and it lets a homeowner see that one corner of a county behaves differently from the rest.
Where state maps carry more detail
A state map is usually the better document for a single address, for three reasons.
It is finer. If your state publishes town-level data and your town is shaded differently from its neighbours, that is information the county map cannot give you.
It is more current in local terms. State programs revise when they have enough new data, and they usually date the map. A 2024 state revision with local measurements can be more useful than a national map built on older inputs.
It is paired with the state’s own programs. The same page that hosts the map usually lists subsidised test kits, certified measurement providers and licensed mitigators. That is practical value a national map does not carry. The state cost guide collects the kit and testing prices.
Where the two maps disagree
Disagreement is common and usually not a scandal. The maps are built at different times from different inputs. A state may have measurements the national model lacked, or may weight geology differently, or may use its own tier definitions.
Three rules keep this manageable.
Prefer the finer unit for local context. If the state map covers your town, it is more specific than a county label, even if the county label is newer.
Prefer the more recent document when the units are the same. A 2025 state county map beats a 2015 national one for that state.
Do not average them. Averaging two predictions produces a third number that no agency published and no measurement supports. Pick the map that fits the question and note the other as context.
States also differ in how they label risk. Some use the EPA three-zone scheme unchanged. Some publish a percentage of homes above the action level by county. Some use their own tiers with different names. Always read the legend before you read the color, because two maps can use identical shading to mean different things.
What neither map can do
Neither map measures a house. This is the part that gets lost in the argument about which map is better.
Every radon map in the United States predicts an area average. The inputs are measurements somewhere in the area, geology, and in the national case aerial radioactivity surveys. None of that knows whether your slab is cracked, whether your sump has a lid, whether the basement is finished, or whether the house is tight enough to hold soil gas.
Two houses on the same street can differ by a large factor for reasons no map at county or town scale can resolve. That is why EPA’s guidance is to test every home regardless of zone, and why a state map, however detailed, is a prior rather than a result.
Using both without overreading either
The useful pattern is: map for context, test for the decision.
Use the state map to set your expectation and your urgency. A town shaded as high risk is a reason to test this month rather than next year, and a reason to look harder at a basement you plan to finish. A town shaded low is a reason to test anyway and then relax if the number is low.
Use the EPA map when you want to compare across state lines, or when your state’s map is old, hard to read or unpublished. It is also the reference behind most building-code designations, so it matters if you are building.
Then test. A short-term kit at $15–$45 with lab analysis takes two to four days and answers the question both maps are approximating. The testing section covers placement and closed-house conditions; the short version is lowest lived-in level, four feet up, 12 hours closed before and during.
Reading a state map correctly
Five checks before you trust a shading.
Check the date. A map without a date is a map you cannot compare with anything.
Check the unit. County, town, township and ZIP are different things, and ZIP codes cross both county and town lines.
Check the legend. Predicted average, percentage of homes above 4 pCi/L and state-specific tiers are not interchangeable.
Check the source note. A map built on a few hundred measurements across a large state is weaker than one built on tens of thousands, and good state programs say so.
Check whether it is a prediction or a count. A map of measured results is a different document from a map of predicted risk, and the two get confused constantly.
A practical sequence
- Open your state health department’s radon page and find your town or county.
- Note the map date, unit and legend, then compare it with the EPA county zone.
- Treat the finer, more recent map as your local prior and the other as context.
- Order a short-term test at $15–$45 and run it under closed-house conditions.
- If the result is at or above 4 pCi/L, confirm it and price mitigation from the foundation, not the map.
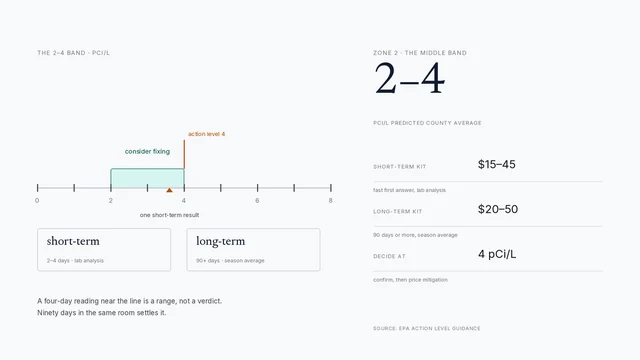
- If it is between 2 and 4, run a long-term kit. If it is below 2, retest in two years.
The map’s job is to make you test sooner. The test’s job is to tell you what you own. Keeping those two jobs separate is the whole skill, and it is worth more than any argument about which map is more accurate.
How to do it
- Start with the state mapFind your state health department's radon page and locate your town or county. Note the date on the map and the thresholds it uses, because states do not all label zones the same way.
- Cross-check the EPA countyCompare the state designation with the EPA county zone. If they agree, you have a consistent prior. If they disagree, prefer the state map for local detail and note the difference.
- Read the legend, not the colorCheck whether the map shows predicted average, percentage of homes above 4 pCi/L, or a state-specific tier. Two maps can use the same colors for different numbers.
- Test the lowest lived-in levelA short-term kit at $15–$45 with lab analysis settles the question the map cannot. Keep the house closed for 12 hours before and during the test and place the detector four feet up.
- Record the map and the result togetherFile the test report with the map you used. If you sell, the measured result matters and the map is context. If you mitigate, retest after 24 hours of operation and every two years after.
Frequently asked questions
What is the difference between a state radon map and the EPA map?
The EPA map assigns one of three zones to every county in the country using a national model. A state radon map is published by the state health department, usually built on the same zone framework but refined with measurements the state collected and with local geology data. Many state maps resolve to town or minor civil division level.
Which map should I use?
Use the state map for local context and the EPA map for the national picture. If your state map shows your town, it is the more specific of the two. Neither one replaces a test of the building, and neither carries the authority of a measurement.
Why do some state maps show towns instead of counties?
Because a county is often too coarse to be useful. States that collected enough measurements at town or township level publish at that scale, and some also overlay bedrock geology. The finer unit gives a better prior, but it is still a prediction about an area and not a reading from your basement.
Can a state radon map tell me whether my house is safe?
No. Every map in this space predicts an area average from measurements, geology and survey data. A house can read far above or below its area's prediction because of soil under the footprint, foundation type, sump condition and air exchange. Only a test measures the house.
Why do the EPA and state maps sometimes disagree?
They are built at different times from different data. A state program may have collected measurements the national model did not include, or weighted local geology differently. A state that publishes its own zones may also use different labels and thresholds. Where they disagree, the state map is usually the more local and more current source.
Where do I find my state radon map?
State health department radon pages publish them, and EPA links to every state program. Most are a single PDF or an interactive map with county or town names. The [state cost guide](/radon-test-cost-by-state/) also lists which programs sell subsidised test kits.
Sources
Some links are affiliate links.If you buy through them we may earn a commission at no extra cost to you. We do not accept payment for rankings. Read the full disclosure.